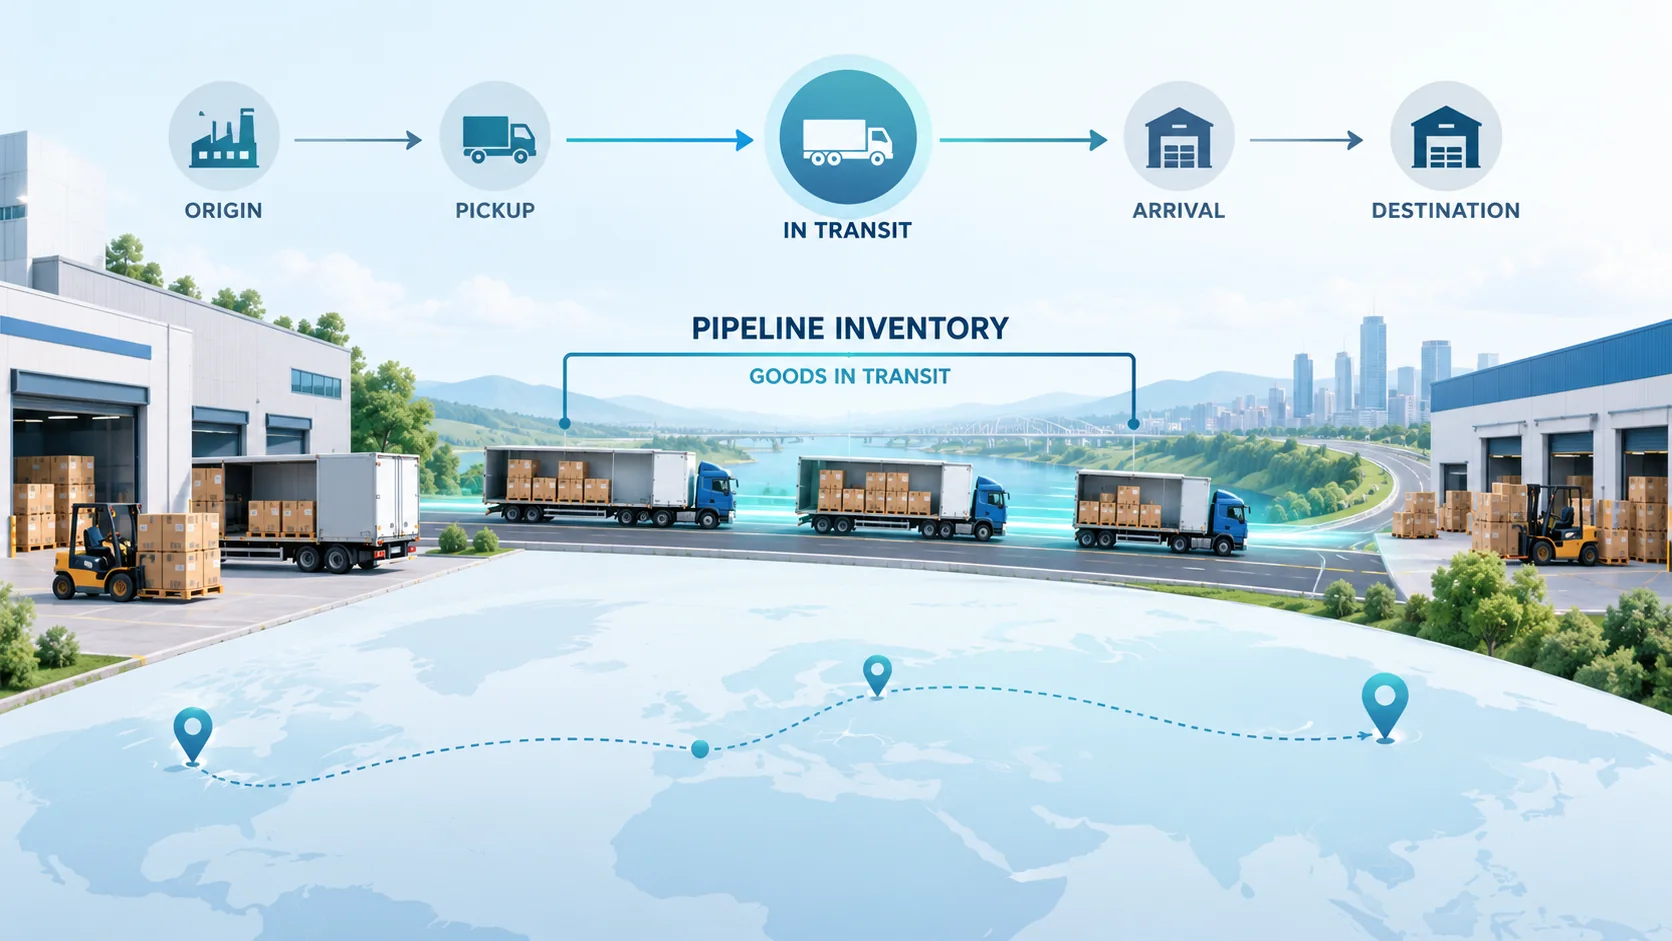
Pipeline inventory is stock moving through the supply process rather than sitting ready for use at its destination. A simple way to understand its average level is to multiply the average flow rate by the average time spent inside a clearly defined part of that process.
By WTM Logistics · Practical explanation with primary-source references and clearly labelled examples
Conceptual goods-in-transit illustration, not a map of WTM facilities or an actual tracked shipment.
Define the pipeline first
Will you count from supplier dispatch to delivery, from carrier collection to unloading, or from purchase order to usable receipt? Each boundary measures a different pipeline. State the boundary before collecting data.
The relationship is commonly expressed as average inventory = average throughput × average time in the system. An MIT research abstract describes the equivalent Little’s Law relationship in a manufacturing context. The worked shipping example below applies the mathematical relationship; it does not transfer that factory’s results to WTM.
A worked transport example
Assume a steady operation sends an average of 60 identical units per day. A unit spends an average of three days between accepted collection and completed receiving.
Average pipeline inventory = 60 units/day × 3 days = 180 units.
If the same flow could be sustained with an average of 2.5 days inside that boundary, the corresponding average would be 150 units. The difference is 30 units.
Scenario
Average flow
Average elapsed time
Average units in the pipeline
Initial example
60/day
3 days
180
Shorter-time example
60/day
2.5 days
150
These are illustrative averages, not a promise of stock savings from changing carriers. They assume comparable units, a stable flow and a consistent measurement boundary.
Know what the average does not say
The result is not the number of units on one truck today. Daily shipment sizes can vary, and some goods may be waiting within the defined process. A current inventory snapshot and a long-run average answer different questions.
Do not multiply pallet throughput by carton lead time without a valid unit conversion. Do not use customer demand as though it equals dispatch throughput when backlog is growing. A changing operation needs closer analysis of the actual flows and period.
Investigate where elapsed time accumulates
Break the overall interval into preparation, collection waiting, transport, receiving waiting and release steps where those fall inside your chosen boundary. That helps locate a useful improvement. Shorter road transit may accomplish little when goods wait longer at an appointment or approval stage.
WTM shipment history and available delivery records can support the transport portion of this timeline. Combine them with your supplier and receiving records; no single courier record necessarily describes the full purchase-to-use cycle.
Is pipeline inventory the same as safety stock?
No. Pipeline inventory describes goods within a flow. Safety stock is a planning buffer. Avoid counting the same units under both labels without a clear definition.
Does reducing transit time automatically reduce purchase quantities?
Not automatically. Ordering policy and replenishment frequency may also need adjustment. The calculation identifies a relationship, not a complete purchasing decision.
Use the WTM Customer Portal to request a shipment, review and approve the quote, pay online and follow real-time GPS tracking. Find issued BOLs, PODs, invoices and shipment history in your account. For a new invitation, email admin@wtmlogistics.com.
For repeat shipping, ask about 10% off recurring shipments. A funded credit account separately offers up to 25% off eligible services. The applicable arrangement is confirmed with your quote; the offers are not automatically combined.
Get a shipping quote
Send the details of your actual shipment. WTM’s quote-response commitment is within 15 minutes.